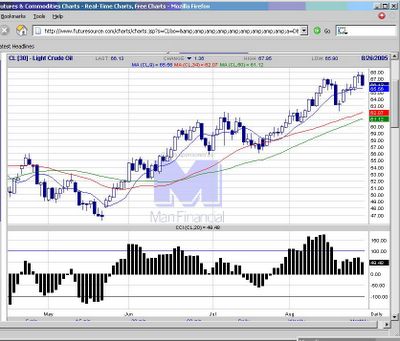
20050826 A down candle showing selling interest, probably profit taking ahead of the weekend amidst news of the hurricane could possibly develop. This comes after 3 days of gains. Look back at the chart and you will see this (and other commodity markets) exhibit a trait of 3 to 4 days move will inevitably be followed by a counter day move in the opposite direction.
 Crude Oil futures chart


0 Comments:
Post a Comment
<< Home