20050630 Continuing pofit taking. The Turtle Soup reversal turned out to be a good one.

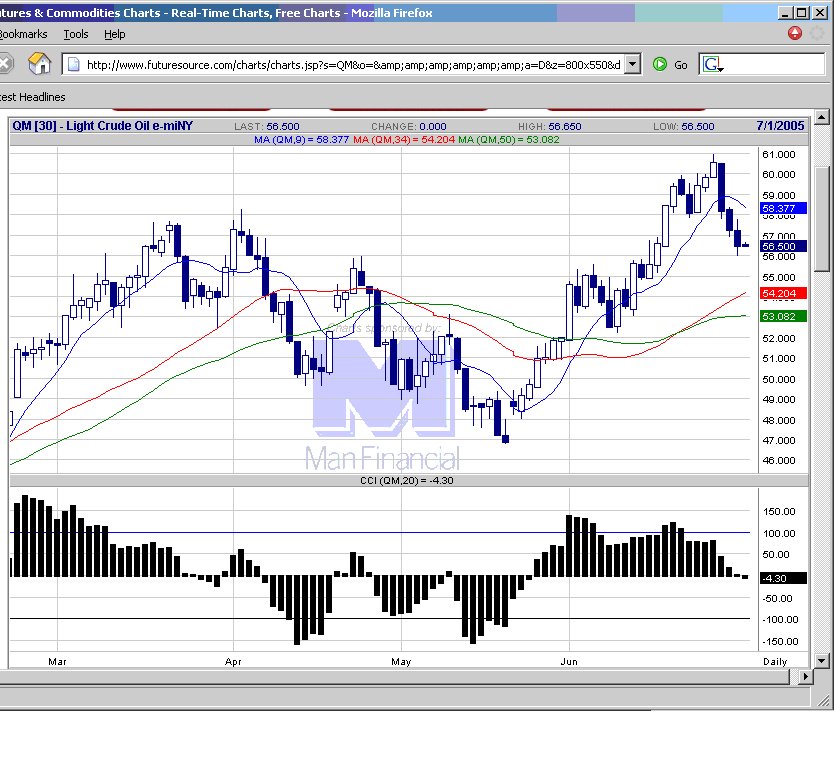 Crude Oil futures chart
posted by emacro @ 5:27 PM
0 comments
![]()
![]()
Crude Oil has been on the radar screen of the public, politicians, economists, analysts and strategists, for the reason that it's price impinges on the prices of other goods. Hence it affects inflation and the cost of living. Blog chronicles trading in crude oil futures on Nymex.
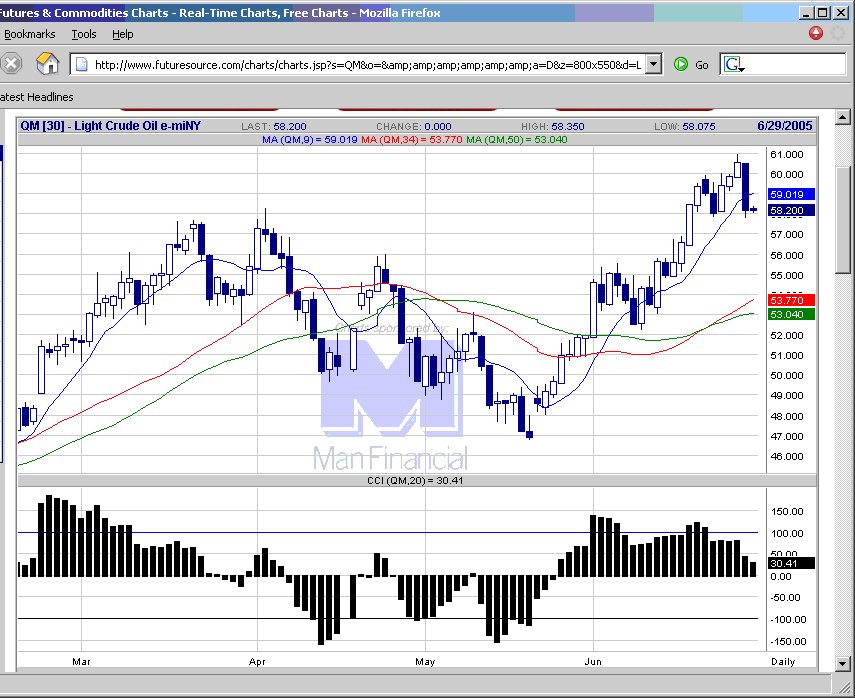
20050630 Continuing pofit taking. The Turtle Soup reversal turned out to be a good one.
Crude Oil futures chart
posted by emacro @ 5:27 PM
0 comments
![]()
![]()
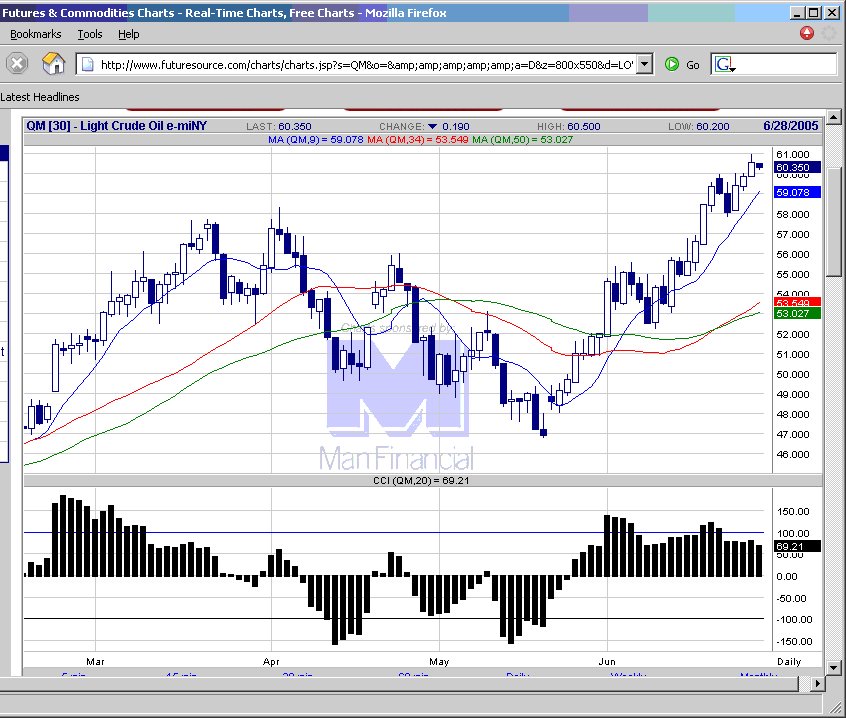
20050628 Reversal bar on Crude Oil as expected, but it started in the non open outcry time, which is a lpointer that the whole 23 hour trade in QM is important.

 Crude Oil futures chart
posted by emacro @ 5:46 PM
0 comments
![]()
![]()
20050628 Days ahead might be looking for a 'turtle soup' reversal. A new 20 day high should be put in, then a sell stop placed around 60-60.10 around the high made last Monday 21 June 2005 w stop placed just above the high. Take partial profits and trail stop on remainder.
 Crude Oil futures chart
posted by emacro @ 2:13 AM
0 comments
![]()
![]()
20050627 CCI is right at the critical juncture where it might break the htl (horizontal trend line). As it stands, momentum wanes a little, so once the htlb comes we could see some profit taking come in.
 Crude Oil futures chart
posted by emacro @ 5:07 PM
0 comments
![]()
![]()
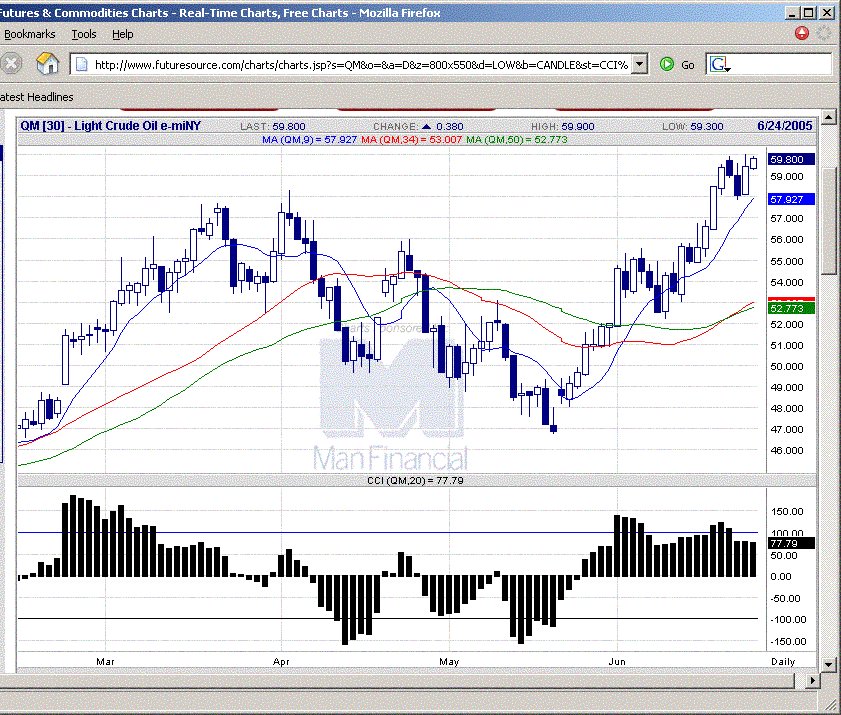
20050624 Uptrend continues, but needs CCI to go through +100 with conviction to indicate continuatin of strong momentum.
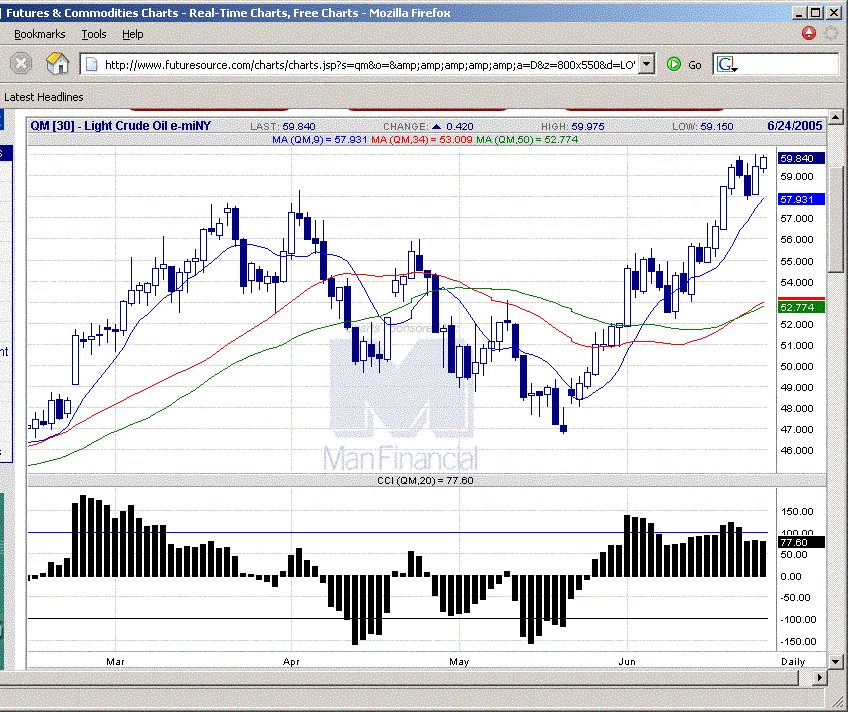 Crude Oil futures chart
posted by emacro @ 6:59 PM
0 comments
![]()
![]()
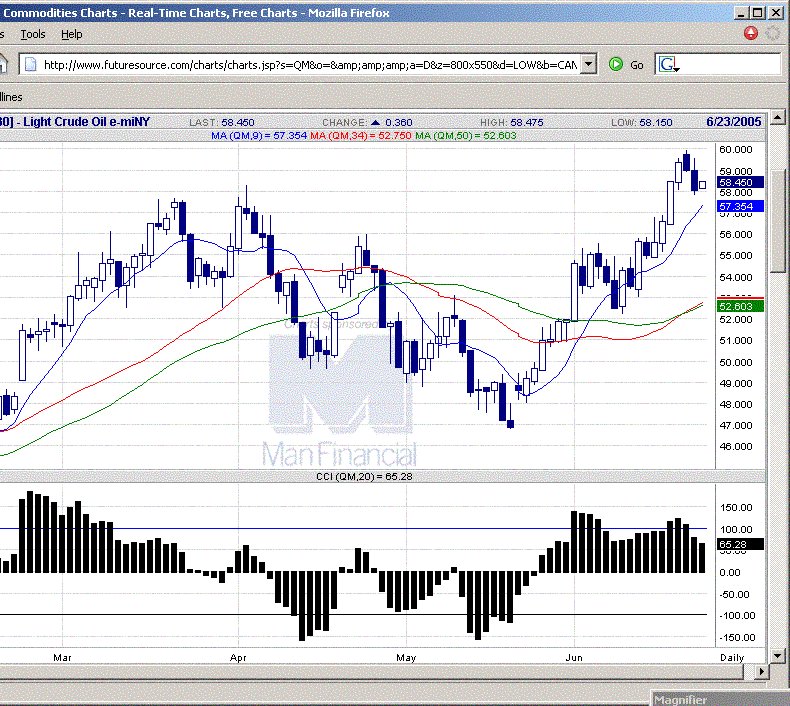
20050623 Move upwards came sooner than expected. Support on this mrket will come in on a US4/barrel move down from any new high made from here on. Good for scalp trade long.
 Crude Oil futures chart
posted by emacro @ 6:29 PM
0 comments
![]()
![]()
20050622 CCI is pulling back to zero. Would be on lookout fr ZLR (CCI hooking and moving in direction of trend) to get long.
 Crude Oil futures chart
posted by emacro @ 10:37 PM
0 comments
![]()
![]()
20050621 CCI fell below +100. Crude oil will range trade, consolidating arund thee levels, since momentum is waning However if the CCI breaks above +100 again, further gains to continue.
 Crude Oil futures chart
posted by emacro @ 5:37 PM
0 comments
![]()
![]()
20050617 Daily chart of QM. Nice momentum still indicates possibility to continue upmove.
 Crude Oil futures chart
posted by emacro @ 4:05 AM
0 comments
![]()
![]()
Light Sweet Crude is traded on the NYMEX (New York Mercantile Exchange) coming into focus in the lst 2 years becaue o the bull market as oil prices surge. This blog will try to analyze the potential moves via daily charts. Will serve as an important resource to commodity traders and hedgers alike.
posted by emacro @ 3:58 AM
0 comments
![]()
![]()


