20050729 Continuation of the upside breakout out of the double ID consolidation. A nice trade that could gain firther if CCI can punch through +100.

 Crude Oil futures chart
posted by emacro @ 7:43 PM
0 comments
![]()
![]()
Crude Oil has been on the radar screen of the public, politicians, economists, analysts and strategists, for the reason that it's price impinges on the prices of other goods. Hence it affects inflation and the cost of living. Blog chronicles trading in crude oil futures on Nymex.
20050729 Continuation of the upside breakout out of the double ID consolidation. A nice trade that could gain firther if CCI can punch through +100.
Crude Oil futures chart
posted by emacro @ 7:43 PM
0 comments
![]()
![]()
20050728 Break out on upside off the 2 ID (inside day) candlesticks, CCI momentum picking up, could see continuation of explosie move.
 Crude Oil futures chart
posted by emacro @ 5:15 PM
0 comments
![]()
![]()
20050727 CCI 3rd day above zero, but not much upside pricee movement or follow through. Interesting the crude oil is coiling the spring with successive ID inside day candlesticks, signalling possibility of strong trend day breakout either side.
 Crude Oil futures chart
posted by emacro @ 7:47 PM
0 comments
![]()
![]()
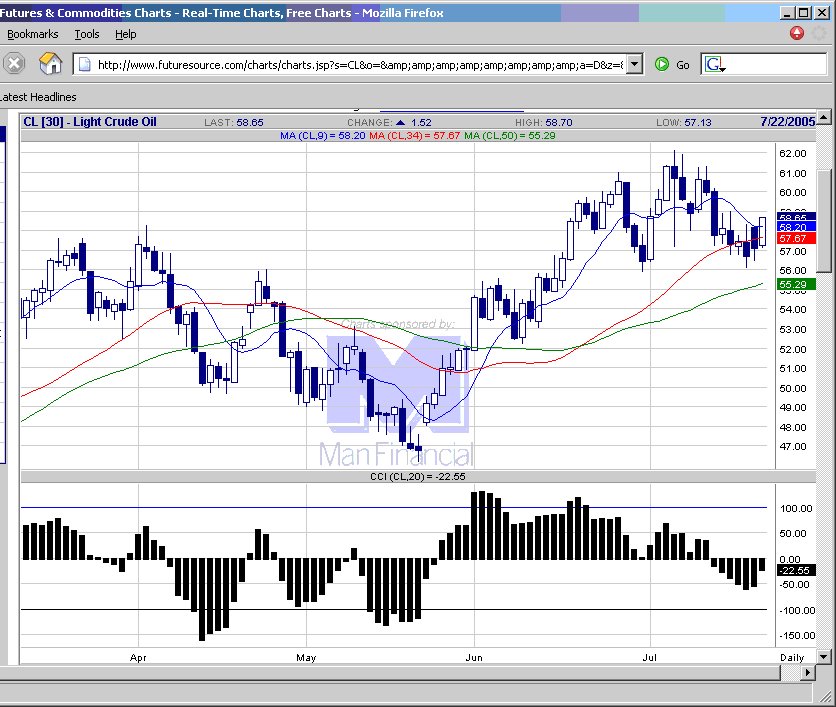
20050725 CCI broke above zero line, indicating crude oil found support, could signal resumption of uptrend if CCI can hold above zero line.
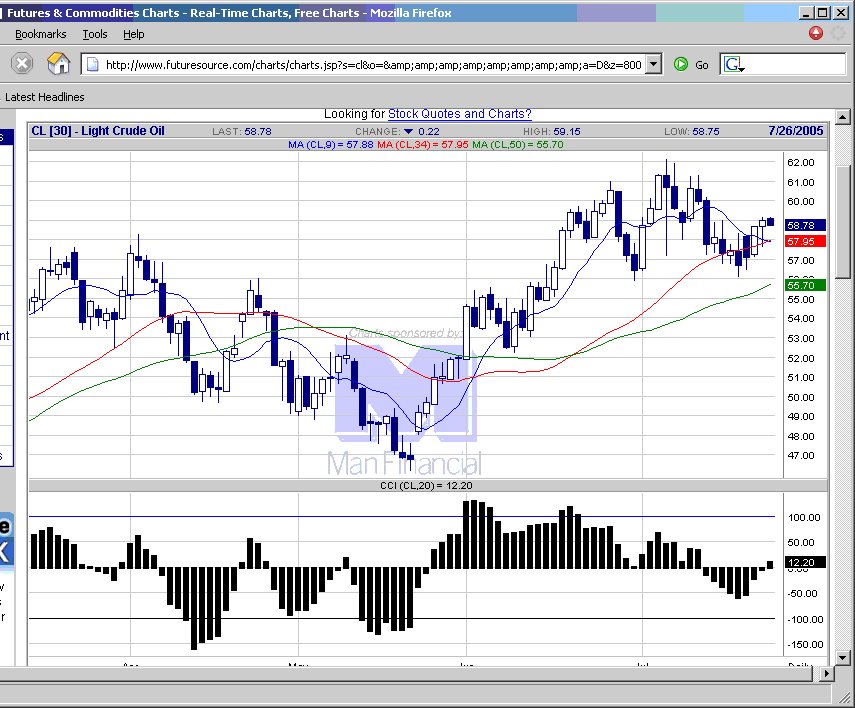 Crude Oil futures chart
posted by emacro @ 11:06 PM
0 comments
![]()
![]()
20050718 Light sweet crude CCI crossed below zero last Thursday, which was the sell signal Moving averages now provide some support. Have to see if momentum accelerates to downside.
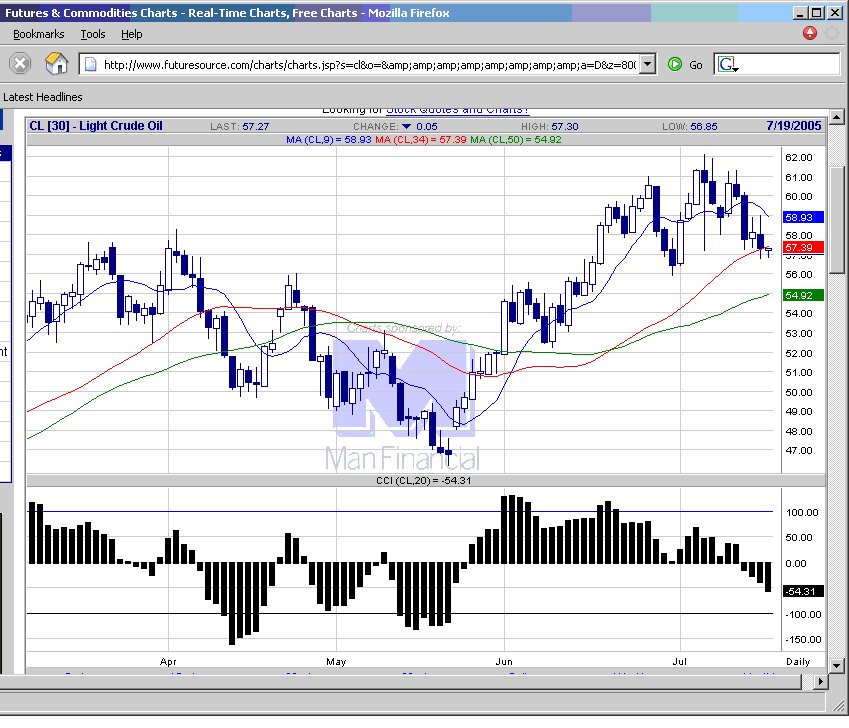 Crude Oil futures chart
posted by emacro @ 4:57 PM
0 comments
![]()
![]()
20050711 Bloomberg TV reports: The hurricane Dennis is expected to be one of the strongest and biggest to hit the mainland USA. It has already killed 32 in Cuba. BUT the oil price has dropped for the last 3 days?? Because the hurricane missed the oil rigs in the area. The reporter says when there is hurricane in the area, traders are well aware of the damage it can cause to oil rigs and refineries and hence the oil price should 'spike'. I thought hurricanes are 1000km in diameter, and this Dennis is "one of the most ferocious for 150 years, with winds of up to 120 miles per hour", so I wonder how it can 'miss' the oil rigs? Moral here is don't listen to this sort of 'news', the chart will tell the story without all the greying of facts and expectations. Crude Oil futures chart
posted by emacro @ 9:40 PM
0 comments
![]()
![]()
 Crude Oil futures chart
posted by emacro @ 2:46 AM
0 comments
![]()
![]()
 Crude Oil futures chart
posted by emacro @ 7:24 PM
0 comments
![]()
![]()
20050707 Now they call the new hurricane Dennis. So the media can hype it's effect on oil supplies as caused by 'Dennis the Menace' Last year the hype was 'Ivan the Terrible'. I seem to recall a few others lst year, just as terrible but with feminine names but no mention to them now?? Draw whatever conclusion you want from this but to me Crude Oil prices are driven by speculators and not fundamentals.
posted by emacro @ 12:22 AM
0 comments
![]()
![]()
 Crude Oil futures chart
posted by emacro @ 5:24 PM
0 comments
![]()
![]()
20050704 Bloomberg TV reports "Traders and analysts expect Crude il prices to hit US80 per barrel this year". Well this is nothing new, considering that just before the Iraq invasion 2 years ago they were expecting crude to hit above US75 per barrel then Also Goldman Sachs, the 'biggest crude oil trader' predicted a 'super spike' of crude to US105 per barrel. That was 3 months ago. Basically all news you hear is supportive of a raging bull spike in crude oil prices Cast our minds back to the Asian Financial Crisis in 1997-1998, the crude oil went to as low as US18 per barrel, and back then expectations were for a spiraling downward acceleration in crude oil prices due to the low demand caused by the economic crisis. News or 'analysts predictions' should be seen in cynicism, they are basically 'position talk' by the big traders who want to or attempt to move the markets in their position's favour. Crude Oil futures chart
posted by emacro @ 7:10 PM
0 comments
![]()
![]()