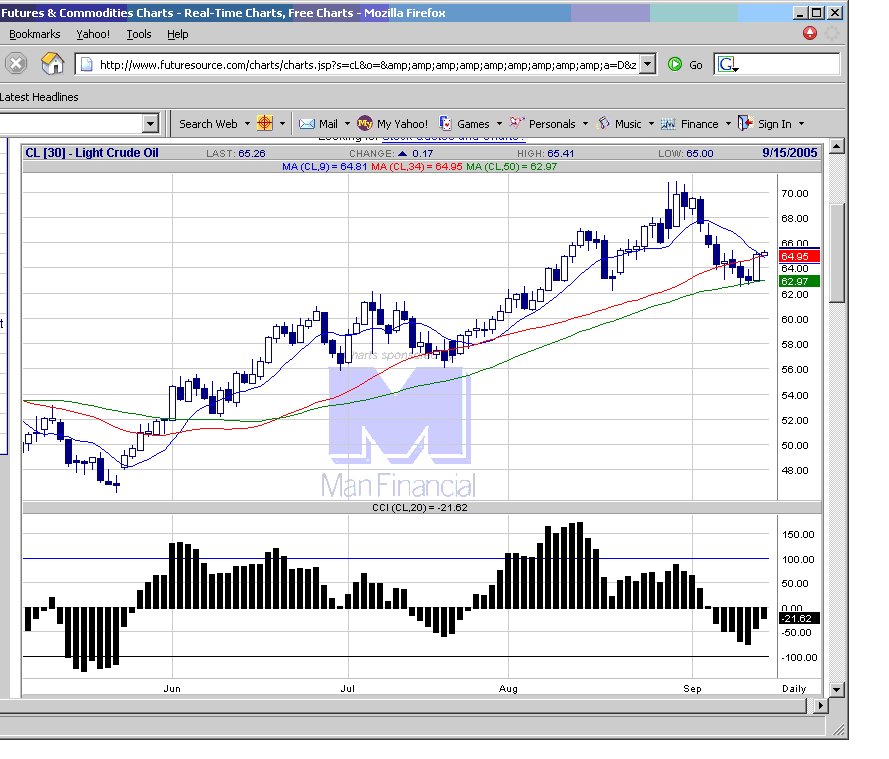
20050930 Sideways action, the expected breakout did not eventuate, but could well come on Monday.

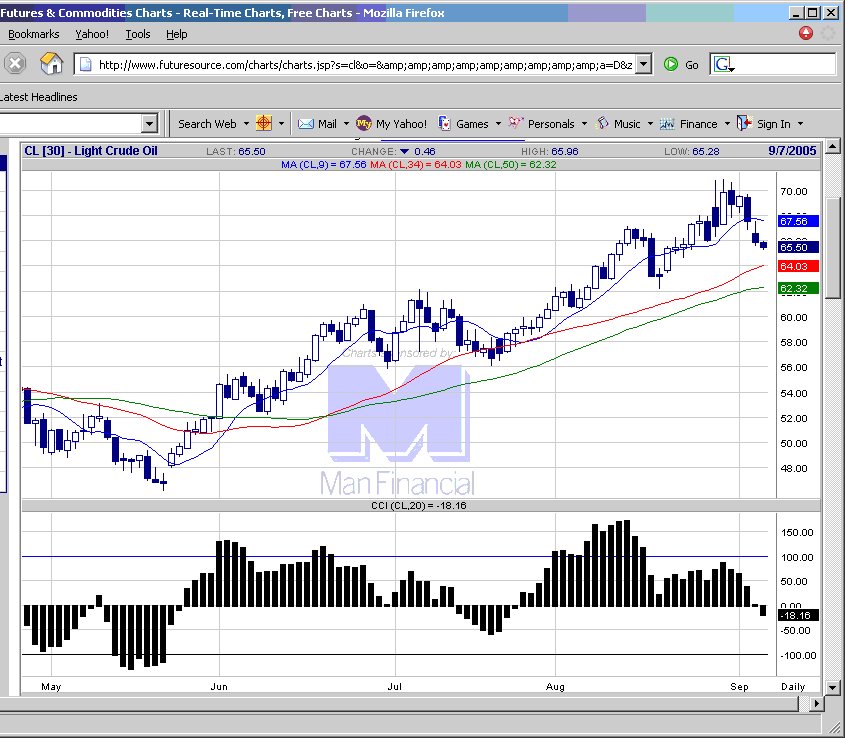
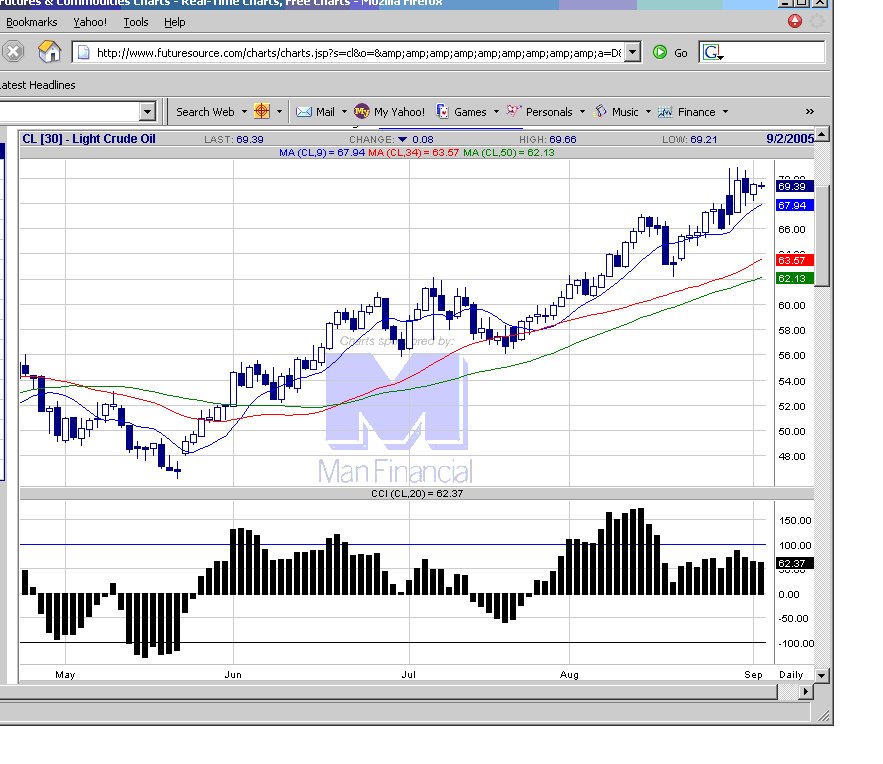
 Crude Oil futures chart
posted by emacro @ 5:56 PM
0 comments
![]()
![]()
Crude Oil has been on the radar screen of the public, politicians, economists, analysts and strategists, for the reason that it's price impinges on the prices of other goods. Hence it affects inflation and the cost of living. Blog chronicles trading in crude oil futures on Nymex.
20050930 Sideways action, the expected breakout did not eventuate, but could well come on Monday.
Crude Oil futures chart
posted by emacro @ 5:56 PM
0 comments
![]()
![]()
 Crude Oil futures chart
posted by emacro @ 6:28 PM
0 comments
![]()
![]()
posted by emacro @ 7:42 PM
0 comments
![]()
![]()
 Crude Oil futures chart
posted by emacro @ 7:36 PM
0 comments
![]()
![]()
 Crude Oil futures chart
posted by emacro @ 6:58 PM
0 comments
![]()
![]()
 Crude Oil futures chart
posted by emacro @ 5:02 PM
0 comments
![]()
![]()
 Crude Oil futures chart
posted by emacro @ 12:38 AM
1 comments
![]()
![]()
 Crude Oil futures chart
posted by emacro @ 6:38 PM
0 comments
![]()
![]()
 Crude Oil futures chart
posted by emacro @ 6:04 PM
0 comments
![]()
![]()
 Crude Oil futures chart
posted by emacro @ 6:15 PM
0 comments
![]()
![]()
 Crude Oil futures chart
posted by emacro @ 5:26 PM
0 comments
![]()
![]()
 Crude Oil futures chart
posted by emacro @ 7:05 PM
0 comments
![]()
![]()
 Crude Oil futures chart
posted by emacro @ 4:59 PM
0 comments
![]()
![]()
 Crude Oil futures chart
posted by emacro @ 6:25 PM
0 comments
![]()
![]()
 Crude Oil futures chart
posted by emacro @ 5:36 PM
0 comments
![]()
![]()
 Crude Oil futures chart
posted by emacro @ 5:04 PM
0 comments
![]()
![]()
 Crude Oil futures chart
posted by emacro @ 5:11 PM
0 comments
![]()
![]()
 Crude Oil futures chart
posted by emacro @ 7:33 PM
0 comments
![]()
![]()
 Crude Oil futures chart
posted by emacro @ 6:33 PM
0 comments
![]()
![]()


