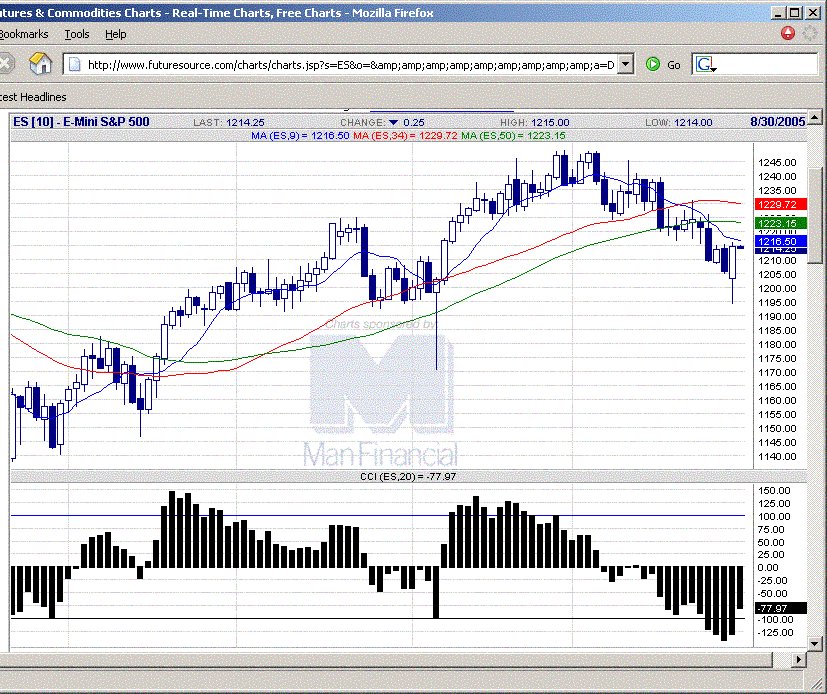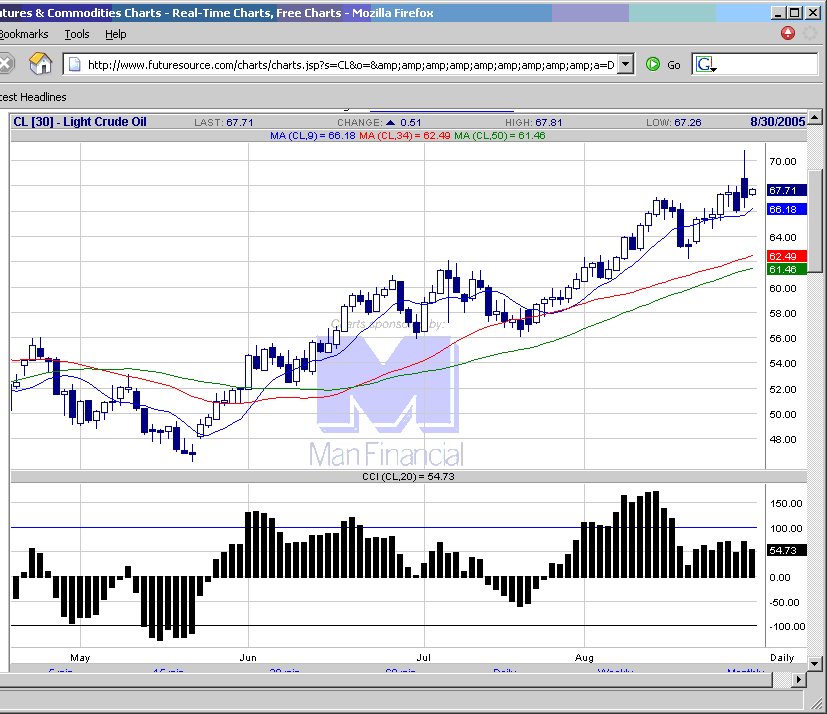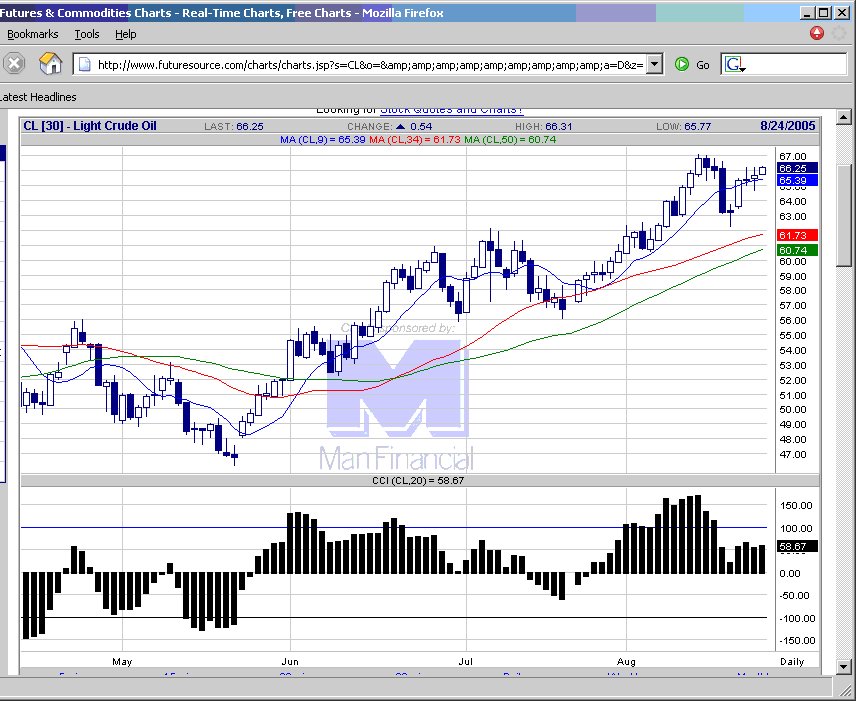
20050831 Turtle soup+1 short triggered, but not much down momentum, still in play. Today show ID pattern, indicates possibilit of breakout either side, so stop tightened to high of today. If break on downside, can consider adding to short position. Some news today on the possible release of SPR (Strategic Petroleum Reserve) to mitigate the economic effects of hurricane Katrina. Could be now the people trading the crude realise that they cannot put cude oil in their cars, so the price of gasoline shuld be the one going up not crude oil?
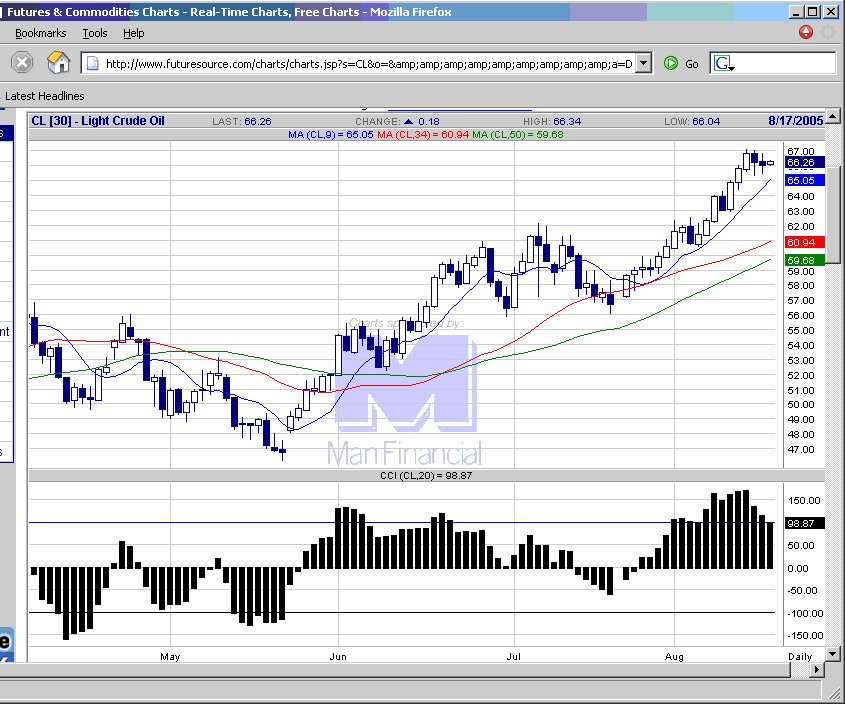
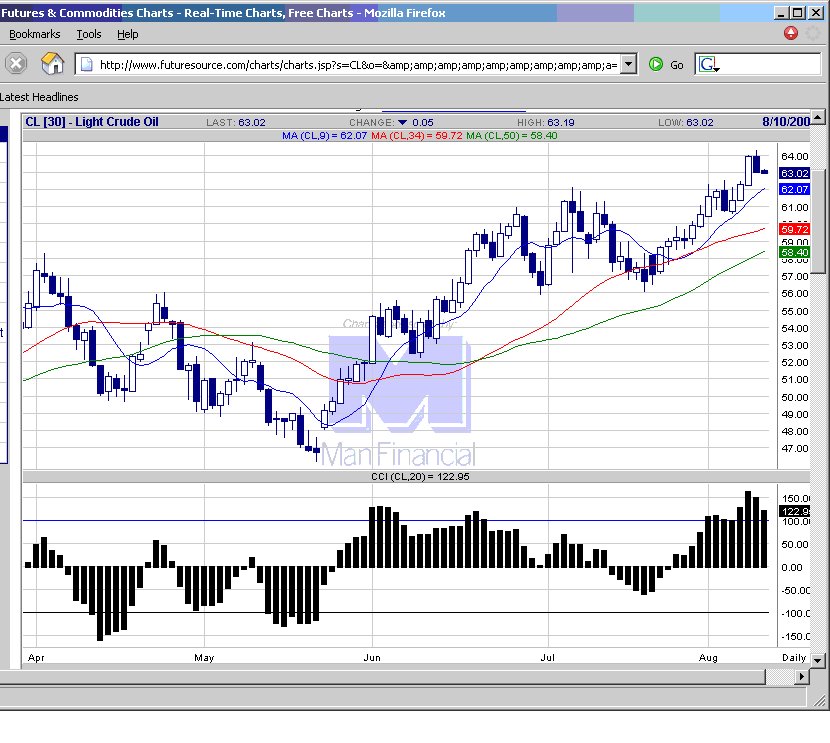
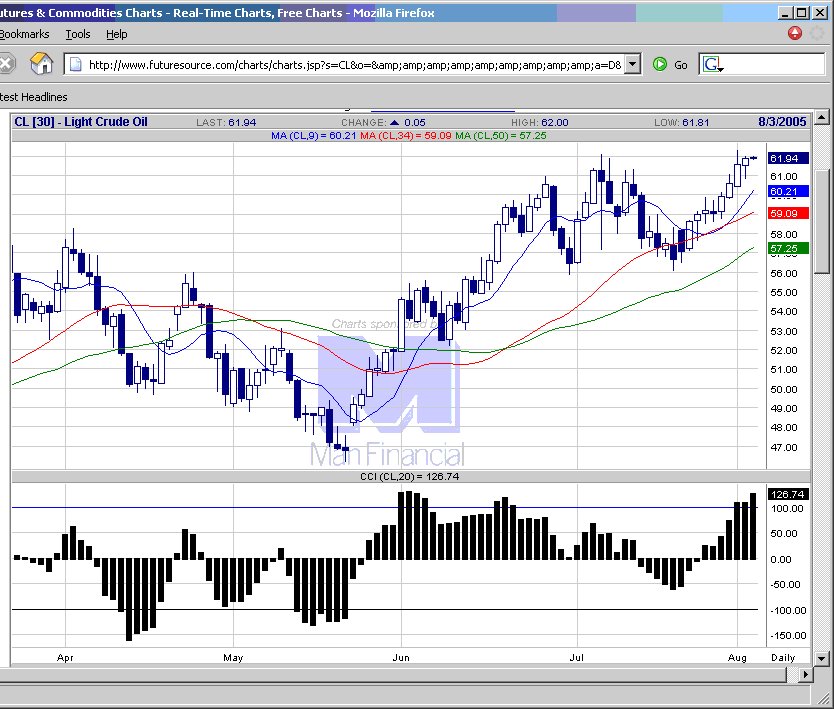
 Crude Oil futures chart
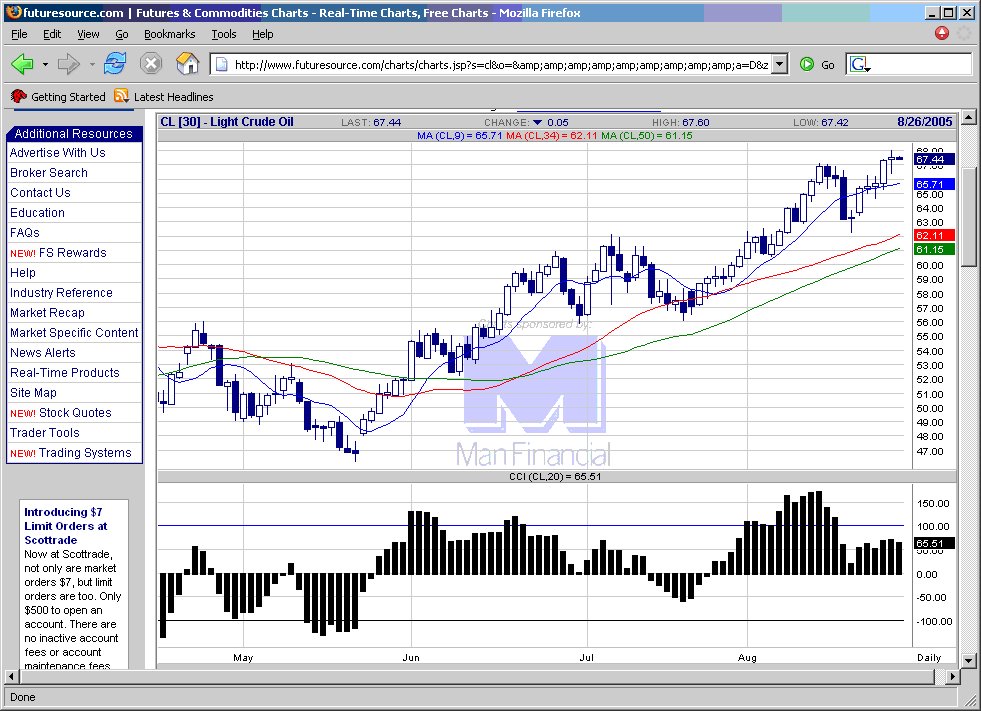
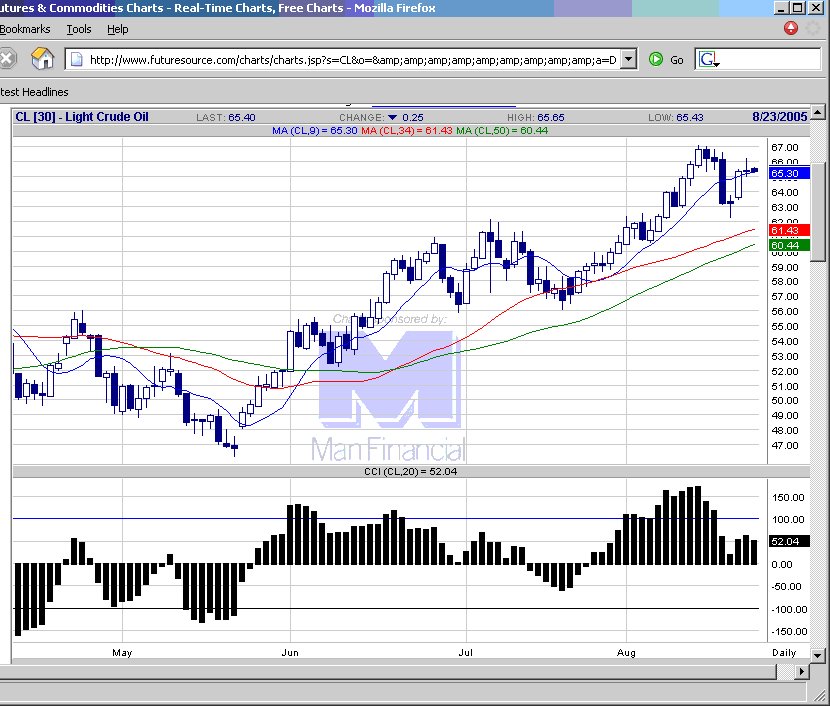
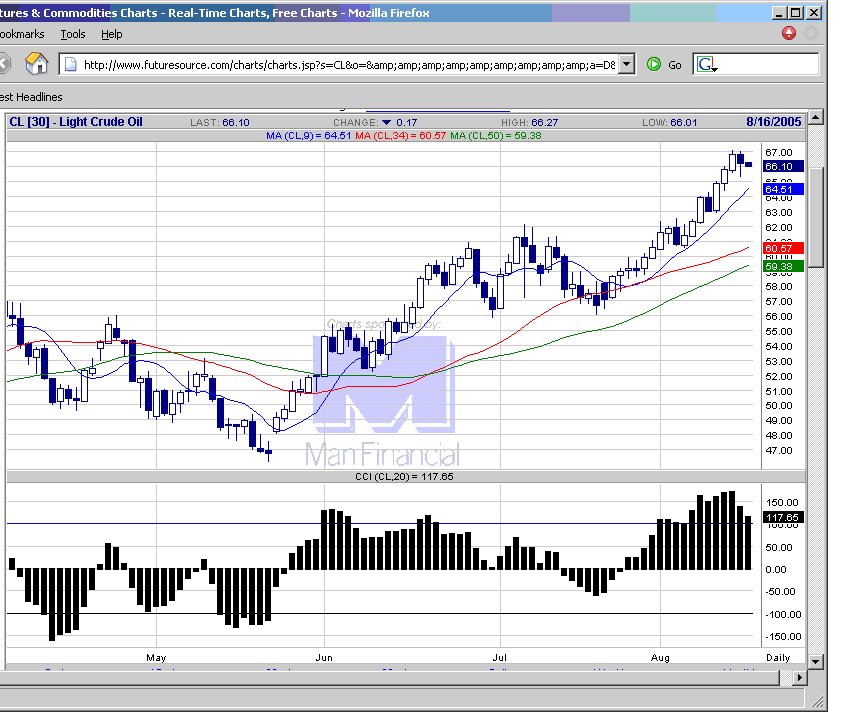
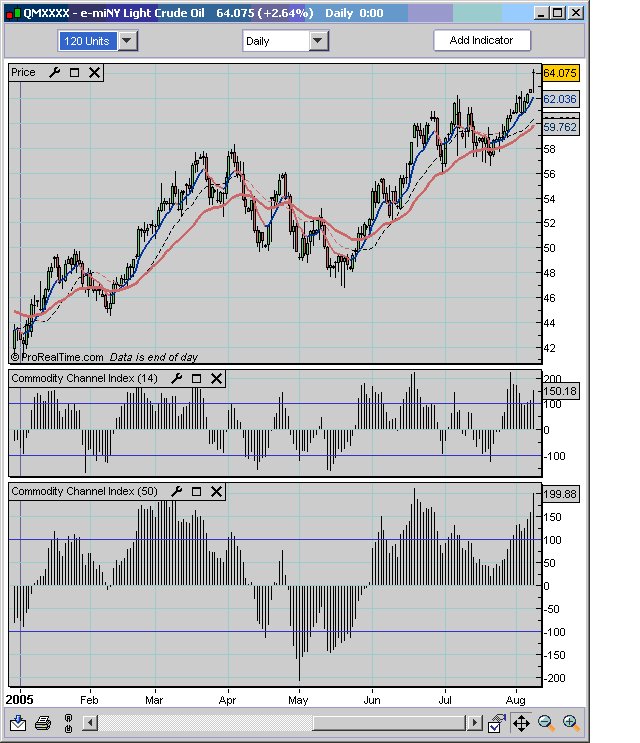
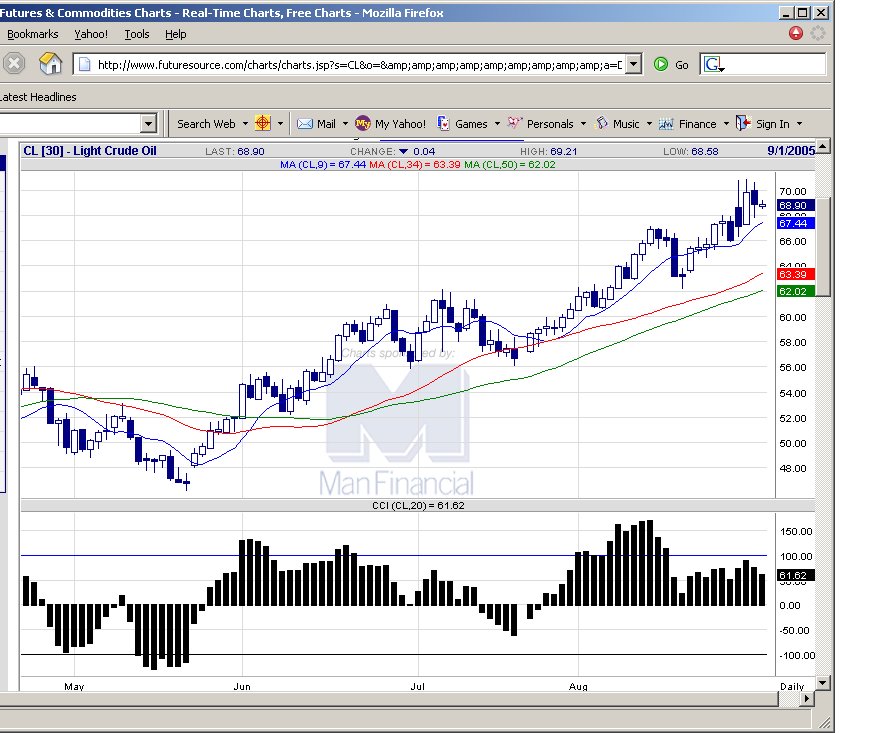
posted by emacro @ 4:49 PM
0 comments
![]()
![]()