posted by emacro @ 4:25 PM
0 comments
![]()
![]()
Crude Oil Futures
Crude Oil has been on the radar screen of the public, politicians, economists, analysts and strategists, for the reason that it's price impinges on the prices of other goods. Hence it affects inflation and the cost of living. Blog chronicles trading in crude oil futures on Nymex.
Tuesday, February 28, 2006
Monday, February 27, 2006
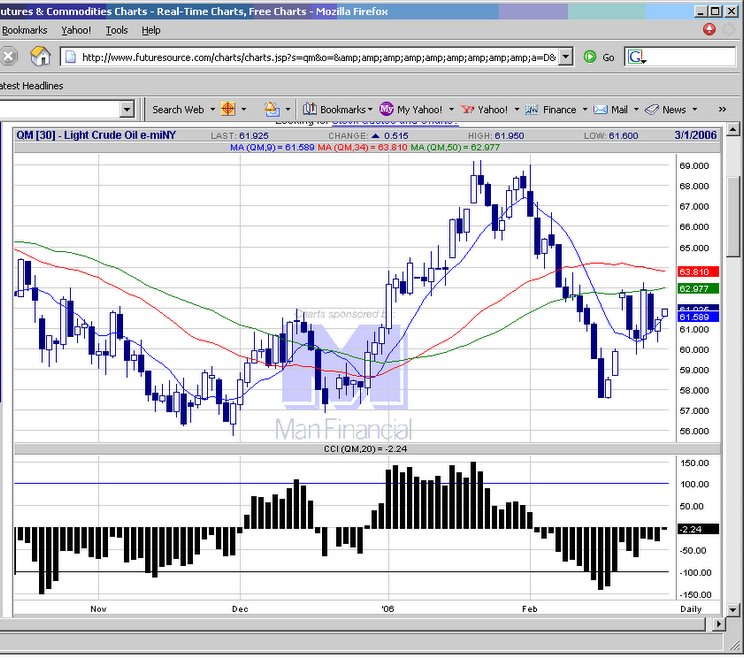
 20060227 No pattern that fits 3 consecutive up or down closes in our setup, waiting.
  Crude Oil futures chart
posted by emacro @ 4:01 PM
0 comments
![]()
![]()
Sunday, February 26, 2006
 20060226 I was surfing throught the web when I chance on this page "Are you looking for leverage into the Oil Market?" I think this is significant in possibly signalling the end of the Crude Oil market bubble that has hyped and built up over the past few year. Whenever there is a new fund r product (structured or otherwie) is launched, it usually signals the end to the trend for that commodity/instrument.
Crude Oil futures chart
20060226 I was surfing throught the web when I chance on this page "Are you looking for leverage into the Oil Market?" I think this is significant in possibly signalling the end of the Crude Oil market bubble that has hyped and built up over the past few year. Whenever there is a new fund r product (structured or otherwie) is launched, it usually signals the end to the trend for that commodity/instrument.
Crude Oil futures chart
posted by emacro @ 12:10 AM
0 comments
![]()
![]()
Friday, February 24, 2006
posted by emacro @ 6:25 PM
0 comments
![]()
![]()
Thursday, February 23, 2006
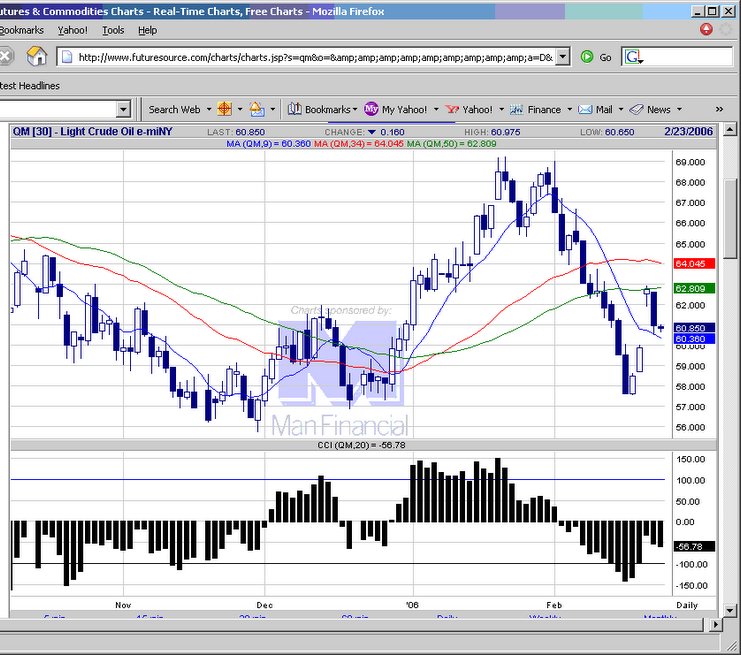
 20060223 Hae the 2nd day of down move. If today ends down with black candlestick can take long trade tomorrow n the open.
Crude Oil futures chart
20060223 Hae the 2nd day of down move. If today ends down with black candlestick can take long trade tomorrow n the open.
Crude Oil futures chart
posted by emacro @ 3:49 PM
0 comments
![]()
![]()
Wednesday, February 22, 2006
posted by emacro @ 3:58 PM
0 comments
![]()
![]()
Tuesday, February 21, 2006

posted by emacro @ 3:53 PM
0 comments
![]()
![]()
Friday, February 17, 2006
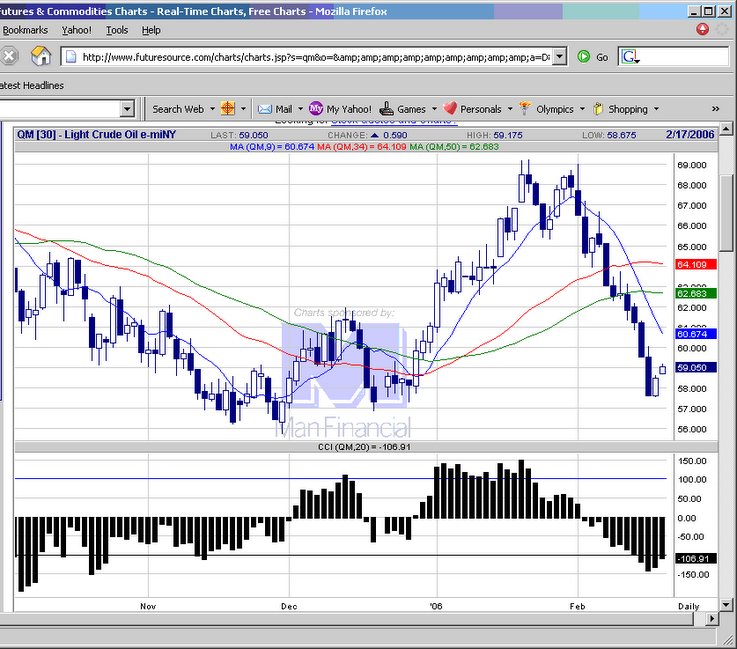
 20060217 Daily QM chat shows the move to take the long positin into a good profit. This is the exception rather than the rule, gains of this magnitude come once in a blue moon.
Crude Oil futures chart
20060217 Daily QM chat shows the move to take the long positin into a good profit. This is the exception rather than the rule, gains of this magnitude come once in a blue moon.
Crude Oil futures chart
posted by emacro @ 5:13 PM
0 comments
![]()
![]()
 20060217 9:30 am ET. Good move up, makes the long swing trade entered at 58.10, a good one, after the previous breakeven stop out.
Crude Oil futures chart
20060217 9:30 am ET. Good move up, makes the long swing trade entered at 58.10, a good one, after the previous breakeven stop out.
Crude Oil futures chart
posted by emacro @ 6:41 AM
0 comments
![]()
![]()
Thursday, February 16, 2006
 20060216 The long position worked out well today with a strong bounce in the crude oil price.
Crude Oil futures chart
20060216 The long position worked out well today with a strong bounce in the crude oil price.
Crude Oil futures chart
posted by emacro @ 3:52 PM
0 comments
![]()
![]()
 20060216 10:09 am ET. Price reached an overnight high of 58.62, which augers well for the long positioin.
Crude Oil futures chart
20060216 10:09 am ET. Price reached an overnight high of 58.62, which augers well for the long positioin.
Crude Oil futures chart
posted by emacro @ 7:11 AM
0 comments
![]()
![]()
Wednesday, February 15, 2006
 2006025 Trailing stop hit and took out the long position. Today long again at US58.10, for the capitulation move.
Crude Oil futures chart
2006025 Trailing stop hit and took out the long position. Today long again at US58.10, for the capitulation move.
Crude Oil futures chart
posted by emacro @ 4:09 PM
0 comments
![]()
![]()

20060215 Further gains going into open outcry session. The setup seems to be quite reliable or the swing trade.
Crude Oil futures chart
posted by emacro @ 6:21 AM
0 comments
![]()
![]()
Tuesday, February 14, 2006
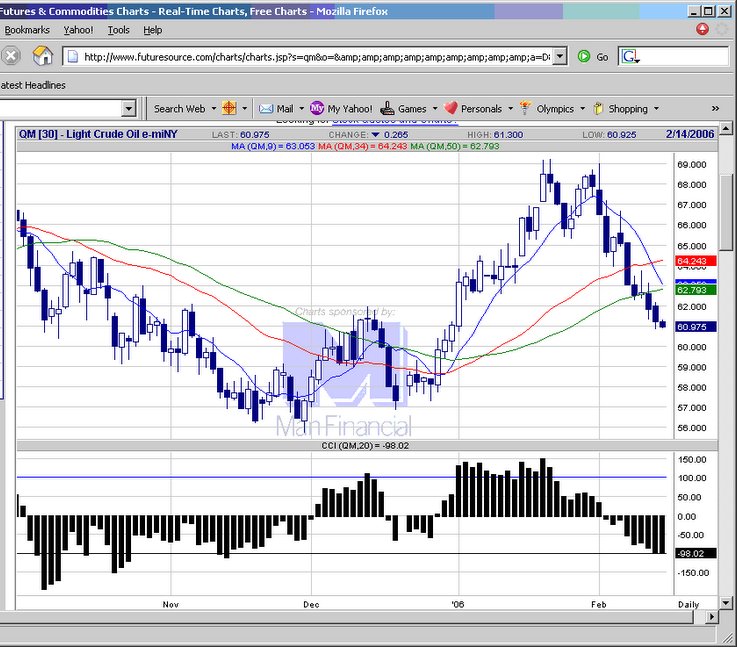
 2006024 We have the 3 consecutie down days, price falls below us60 per barrel. Long on the open today 59.35.
Crude Oil futures chart
2006024 We have the 3 consecutie down days, price falls below us60 per barrel. Long on the open today 59.35.
Crude Oil futures chart
posted by emacro @ 4:10 PM
0 comments
![]()
![]()
Monday, February 13, 2006
 20060213 A second day of down candlestick. Waiting to see if today ends up down to take longs tomorrow.
Crude Oil futures chart
20060213 A second day of down candlestick. Waiting to see if today ends up down to take longs tomorrow.
Crude Oil futures chart
posted by emacro @ 4:26 PM
0 comments
![]()
![]()
Friday, February 10, 2006
Thursday, February 09, 2006
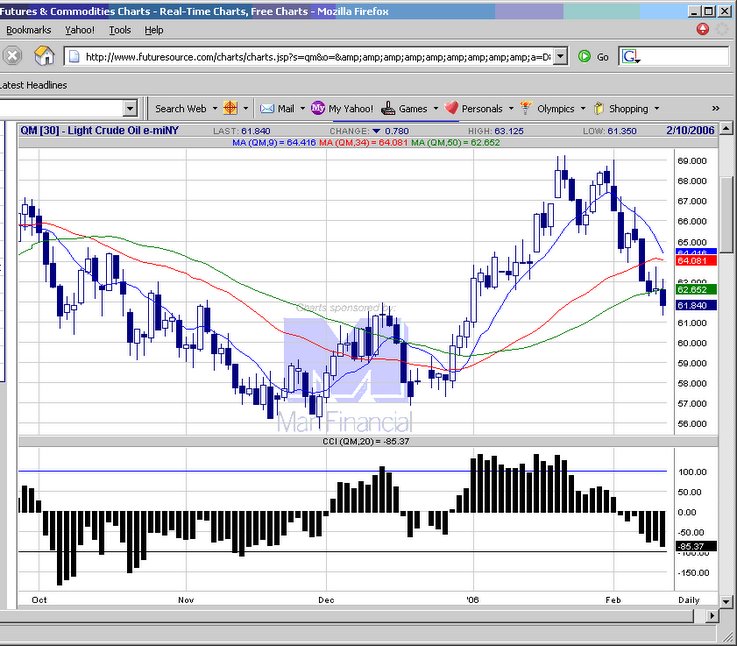
 20060209 After 3 days down, a small up day, but intraday crude did reach above 63, so the long position at 62.55 was in profit.
Crude Oil futures chart
20060209 After 3 days down, a small up day, but intraday crude did reach above 63, so the long position at 62.55 was in profit.
Crude Oil futures chart
posted by emacro @ 4:05 PM
0 comments
![]()
![]()
Wednesday, February 08, 2006
 20060208 3rd consecutive dwn day. Long at the market at 62.55. Let's sse how this trade does.
Crude Oil futures chart
20060208 3rd consecutive dwn day. Long at the market at 62.55. Let's sse how this trade does.
Crude Oil futures chart
posted by emacro @ 4:02 PM
0 comments
![]()
![]()
Tuesday, February 07, 2006
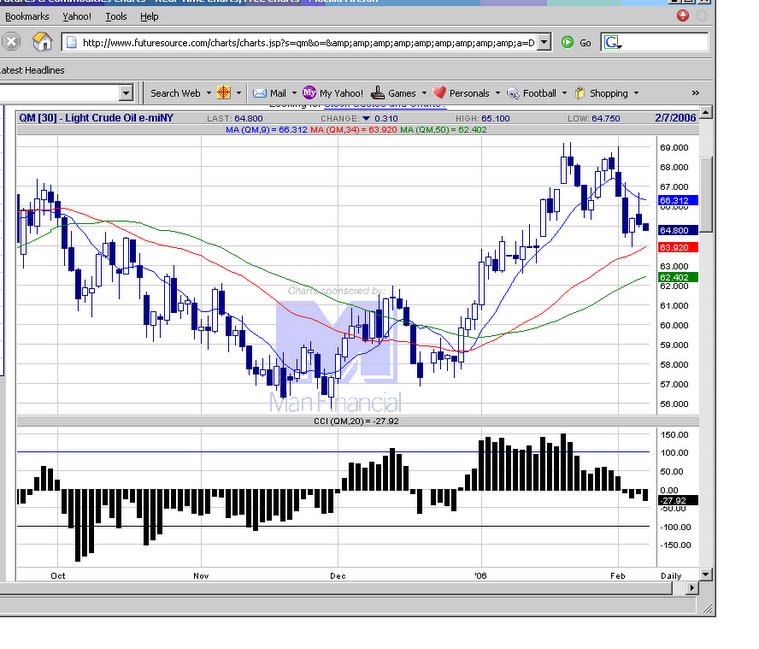
 20060207 A second consecutive day of losses, looking for action on 8/2/2006 to determine if a setup for long trade comes up.
Crude Oil futures chart
20060207 A second consecutive day of losses, looking for action on 8/2/2006 to determine if a setup for long trade comes up.
Crude Oil futures chart
posted by emacro @ 3:44 PM
0 comments
![]()
![]()
Monday, February 06, 2006
 20060206 Mov avg level caps the up move. Staying flat to wait for the next setup.
Crude Oil futures chart
20060206 Mov avg level caps the up move. Staying flat to wait for the next setup.
Crude Oil futures chart
posted by emacro @ 3:36 PM
0 comments
![]()
![]()
Sunday, February 05, 2006
 20060203 An up day, as expected after 3 ocnsecutive down days. This is a high probability pattern.
Crude Oil futures chart
20060203 An up day, as expected after 3 ocnsecutive down days. This is a high probability pattern.
Crude Oil futures chart
posted by emacro @ 6:11 PM
0 comments
![]()
![]()
Thursday, February 02, 2006
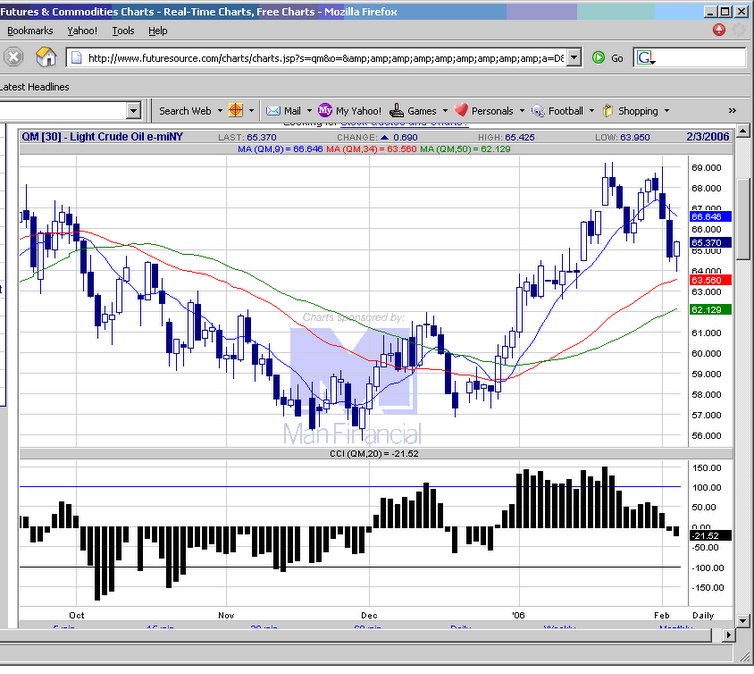
 20060202 We have the 3rd day down today with a plunge in the crude oil price. Should have an up day today, if the pattern holds.
Crude Oil futures chart
20060202 We have the 3rd day down today with a plunge in the crude oil price. Should have an up day today, if the pattern holds.
Crude Oil futures chart
posted by emacro @ 4:34 PM
0 comments
![]()
![]()
Wednesday, February 01, 2006
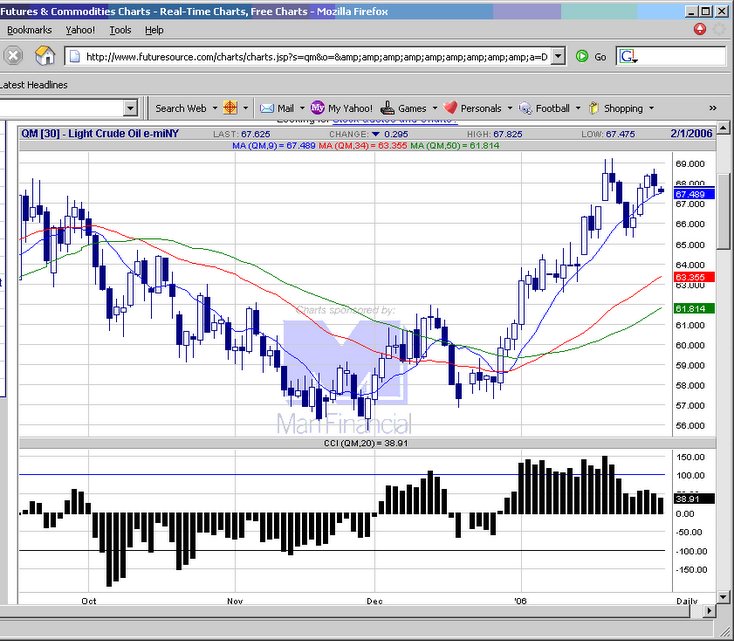
 20060201 A 2nd down day. If the close of 2 Feb is down sets up opportunity of a swing trade long.
Crude Oil futures chart
20060201 A 2nd down day. If the close of 2 Feb is down sets up opportunity of a swing trade long.
Crude Oil futures chart
posted by emacro @ 5:01 PM
0 comments
![]()
![]()
 20060131 After 3 straight days gains, a day of falls. This pattern is peculiar to the crude oil market.
Crude Oil futures chart
20060131 After 3 straight days gains, a day of falls. This pattern is peculiar to the crude oil market.
Crude Oil futures chart
posted by emacro @ 1:43 AM
0 comments
![]()
![]()
Sponsors
- 20110525 Crude Oil futures hourly.
- 20100813 Crude Oil futures 5 min chart update...
- 20100813 5 min crude oil futures chart with ADX, u...
- Fwd:
- 20100811 Crude Oil futues 2 min chart for this af...
- Phillip Futures Malaysia Sdn Bhd is a licensed fut...
- 20081219 How wrong we were.... The price is for cu...
- 20081212 Crude oil has pushed through mov avg resi...
- 20081031 If the crude oil futures makes another te...
- Gold Silver, agriculture products and oil plummet ...
- June 2005
- July 2005
- August 2005
- September 2005
- October 2005
- November 2005
- December 2005
- January 2006
- February 2006
- March 2006
- April 2006
- May 2006
- June 2006
- July 2006
- August 2006
- September 2006
- October 2006
- November 2006
- December 2006
- January 2007
- February 2007
- March 2007
- April 2007
- May 2007
- June 2007
- July 2007
- August 2007
- September 2007
- October 2007
- May 2008
- June 2008
- July 2008
- August 2008
- September 2008
- October 2008
- December 2008
- July 2010
- August 2010
- May 2011
- Current Posts
Links
Previous Posts
Archives

Syndicate this site


