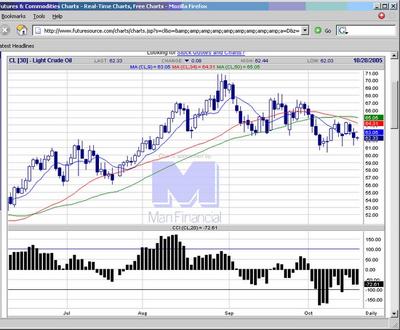
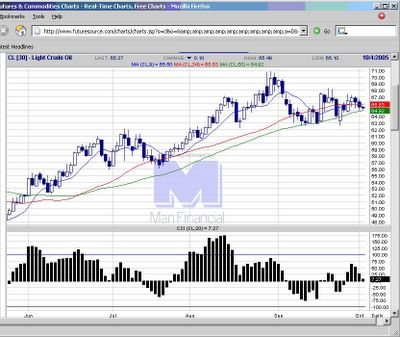
20051031 Crude Oil futures close below US60, confirming the weakening bear trend. As usual, the analyst (few posts ago) was off the mark, or more likely trying to shore up the stale bull positions with talk. Looking for rallies to short. The market seems immune to so called 'supply shocks' like the news today on the strike by the Shell refinery workers in Europe. Crude Oil futures chart
Crude Oil Futures
Crude Oil has been on the radar screen of the public, politicians, economists, analysts and strategists, for the reason that it's price impinges on the prices of other goods. Hence it affects inflation and the cost of living. Blog chronicles trading in crude oil futures on Nymex.
Monday, October 31, 2005
Friday, October 28, 2005
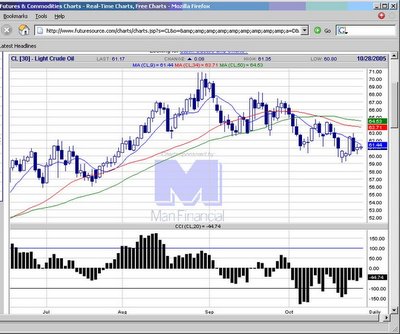
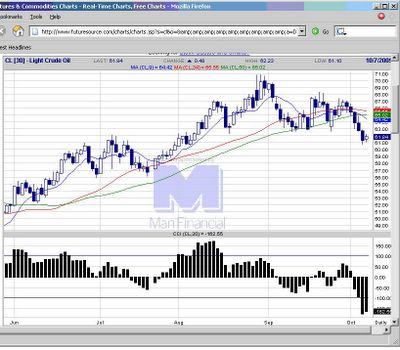
20051028 Two ID in a row-points to a breakout either side of today's high and low. Crude Oil futures chart
Thursday, October 27, 2005
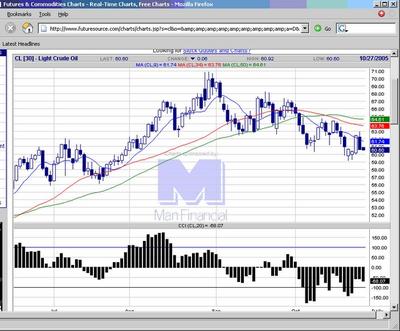
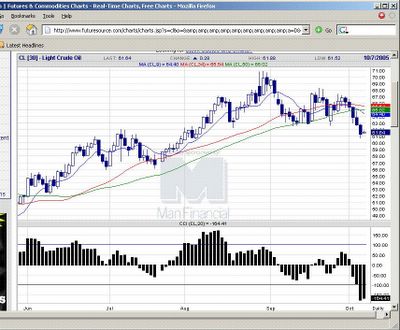
20051027 Sideways action as expected The stale bulls still trying to talk the crude oil up. Crude Oil futures chart
Wednesday, October 26, 2005
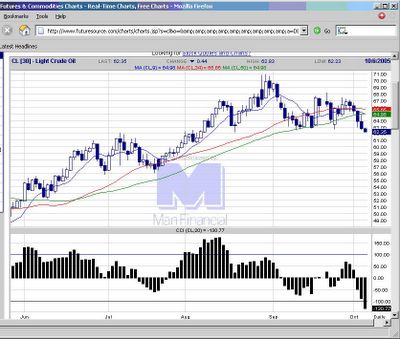
20051026 Higher high made, but closed down. Consolidation may set in for sideways move. Crude Oil futures chart
Tuesday, October 25, 2005
Monday, October 24, 2005
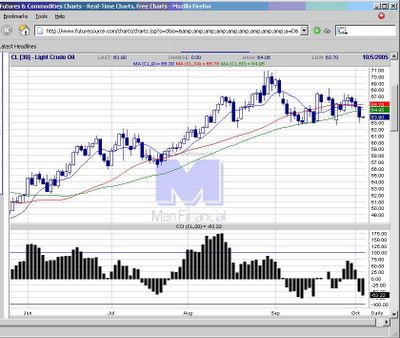
20051024 An ID pattern today, indicating the possibility of a breakout trade if either the high or the low are taken out today. Crude Oil futures chart
Friday, October 21, 2005
20051021 New low made today, but short covering brings price up ahead of weekend. Waiting for next opportunity to short for position trade. Crude Oil futures chart
Thursday, October 20, 2005
20051020 Downtrend makes new lows, confirming the downtrend. Looking for next opportunity to short. Crude Oil futures chart
Wednesday, October 19, 2005
20051019 Downtrend continues, despite the stale bulls trying to scare traders with hurricane fears past week. Crude Oil futures chart
Tuesday, October 18, 2005
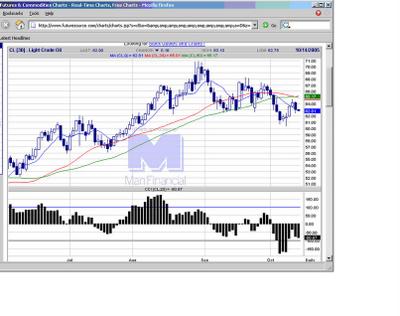
20051018 An Inside day (ID) pattern appears today, setting up a breakout trade either side today. Crude Oil futures chart
Monday, October 17, 2005
20051017 Weather again. Tropical storm Wilma moving into the Gulf, stale bulls hype up the effects. Once again the technicals are screwed by the weather. Crude Oil futures chart
Friday, October 14, 2005
20051014 Downtrend continues, thugh the candestick shows some buying support. Have to see if the market can test below US60 per barrel. Crude Oil futures chart
Thursday, October 13, 2005
Wednesday, October 12, 2005
2005012 65.14 is the resistance, would be a good level to take shorts against for continuation of the downtrend after this corrective move up. Crude Oil futures chart
Tuesday, October 11, 2005
20051011 Upside breakout of the consolidation range, as we suspected, a strong rally unsued.
Crude Oil futures chart
Monday, October 10, 2005
20051010 Found support around 62 level, with sideways movement, waiting for next signal, which could be a breakout of this range, though the ID is not too clear cut.
Crude Oil futures chart
Friday, October 07, 2005
20051007 An Inside Day ID pattern, could be indicating potential for breakout.
Crude Oil futures chart
Thursday, October 06, 2005
20051006 Downtrend in place, a good point to short would be around 65.50-66 level, the symmetry resistance point.
Crude Oil futures chart
Wednesday, October 05, 2005
20051005 Further selling, despite the 'super spikers' who still anticipated the inventory data to fully reflect the depletion of stocks from the hurricane disasters. So looks like long liquidation from those 'supre spikers'.
Crude Oil futures chart
Tuesday, October 04, 2005
20051004 3rd day down, so today could be an opportunity to long for the swing trade back up.
Crude Oil futures chart
Monday, October 03, 2005
20051003 If today is 3rd day where close lower than the open, will set up a buying day opportunity, best if stays above the moving averages for closing.
Crude Oil futures chart